MedTrucks – back to home
English
MedTrucks – back to home

For public decision-makers · ARS · GRADeS · Local authorities
Understand local healthcare needs to take action where it matters most

Understand local healthcare needs to take action where it matters most

Understand local healthcare needs to act where it matters most

The platform allows you to identify underserved areas, anticipate upcoming retirements, and deploy your regional healthcare programs

The platform allows you to identify underserved areas, anticipate upcoming retirements, and deploy your regional healthcare programs

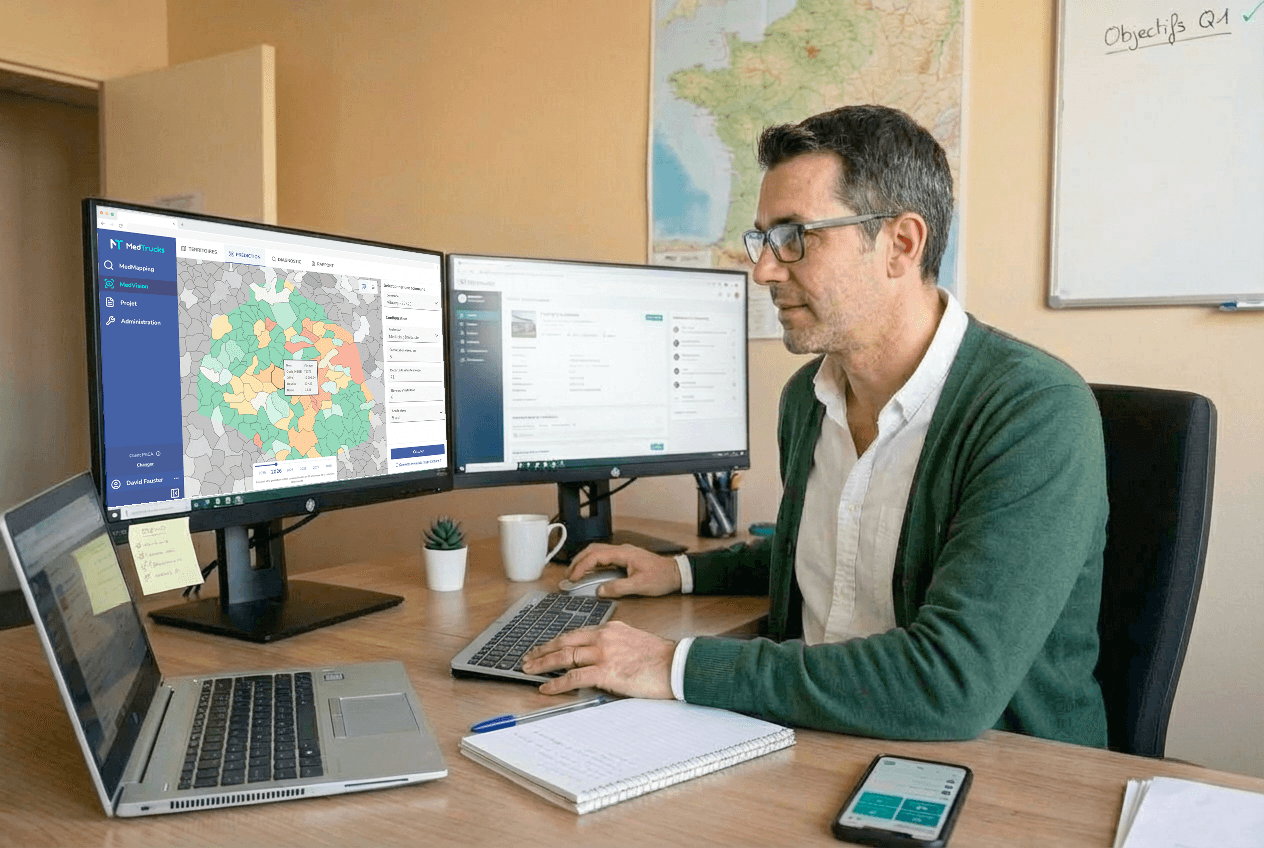
Man working on dual screens showing the MedTrucks MedVision tool

They manage healthcare across their regions with MedTrucks

  • IESS (Innovation e-Santé Sud) logo
  • DAC Var Ouest Logo
  • e-Meuse Santé logo
  • ARS PACA Logo
  • Pulsy logo
  • DAC 55 logo
  • UGAP Logo
  • IESS (Innovation e-Santé Sud) logo
  • DAC Var Ouest Logo
  • e-Meuse Santé logo
  • ARS PACA Logo
  • Pulsy logo
  • DAC 55 logo
  • UGAP Logo

The obstacles that reduce your ability to act

Woman presenting the MedTrucks MedVision tool displaying a map of France
Data that cannot be combined

You have data in ROR, FINESS, INSEE demographics... but no easy way to cross-reference it all.
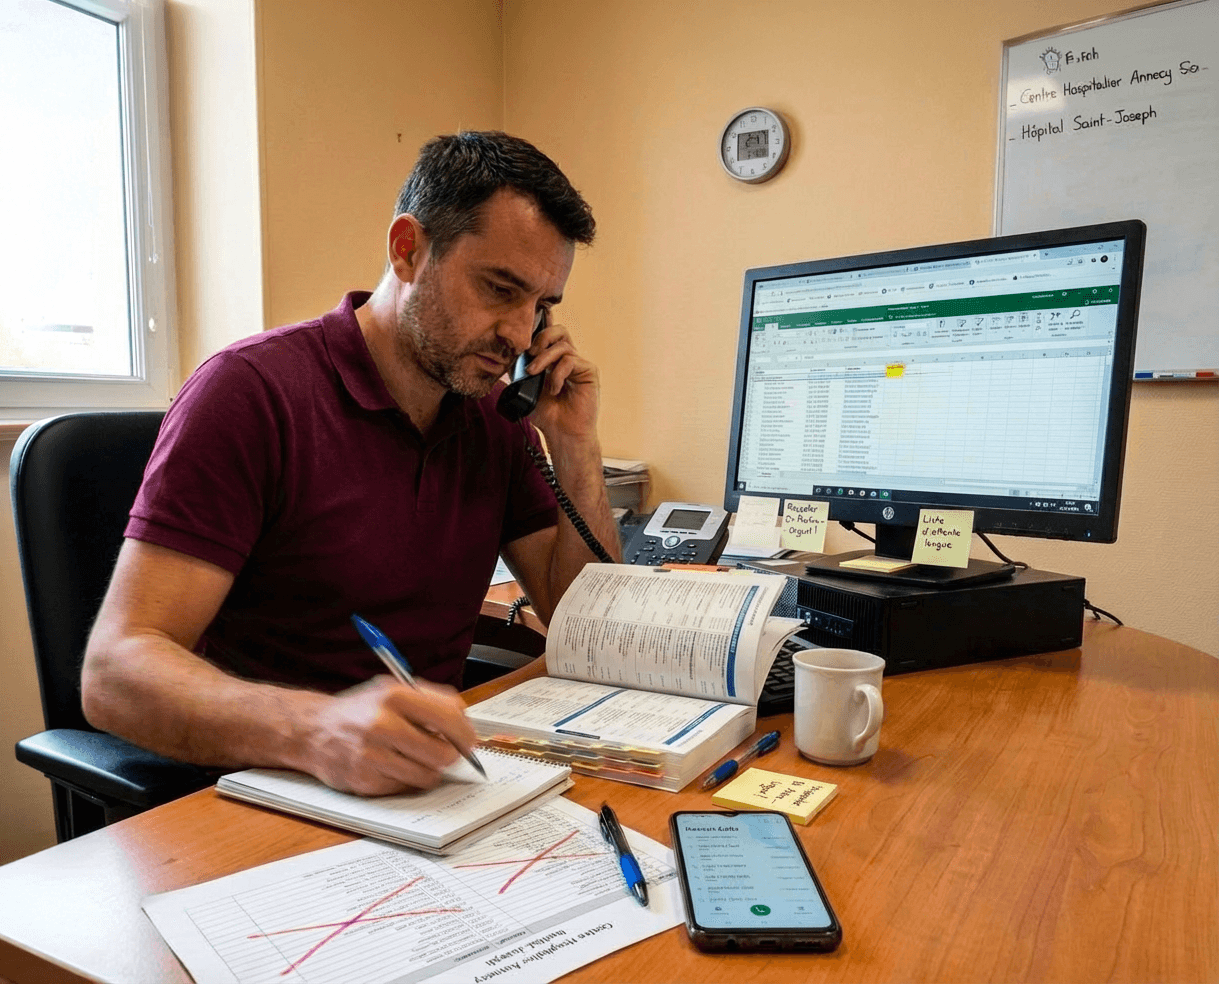
Man on the phone taking notes in front of a data spreadsheet
Diagnoses that take 6 months

Between data collection, cleaning, analysis, and formatting, your local healthcare assessments take 6 months of work.

Working meeting around a laptop displaying charts
No vision for the future of your territory

You don't know how many doctors will retire in 5 years, or where the next shortages will hit

Hard to justify your decisions

Without consolidated dashboards and solid figures, convincing your leadership or the ARS to fund your programs becomes an uphill battle.

Man on the phone reviewing a spreadsheet with charts at his desk

MedTrucks was designed to help you expand your reach across your region
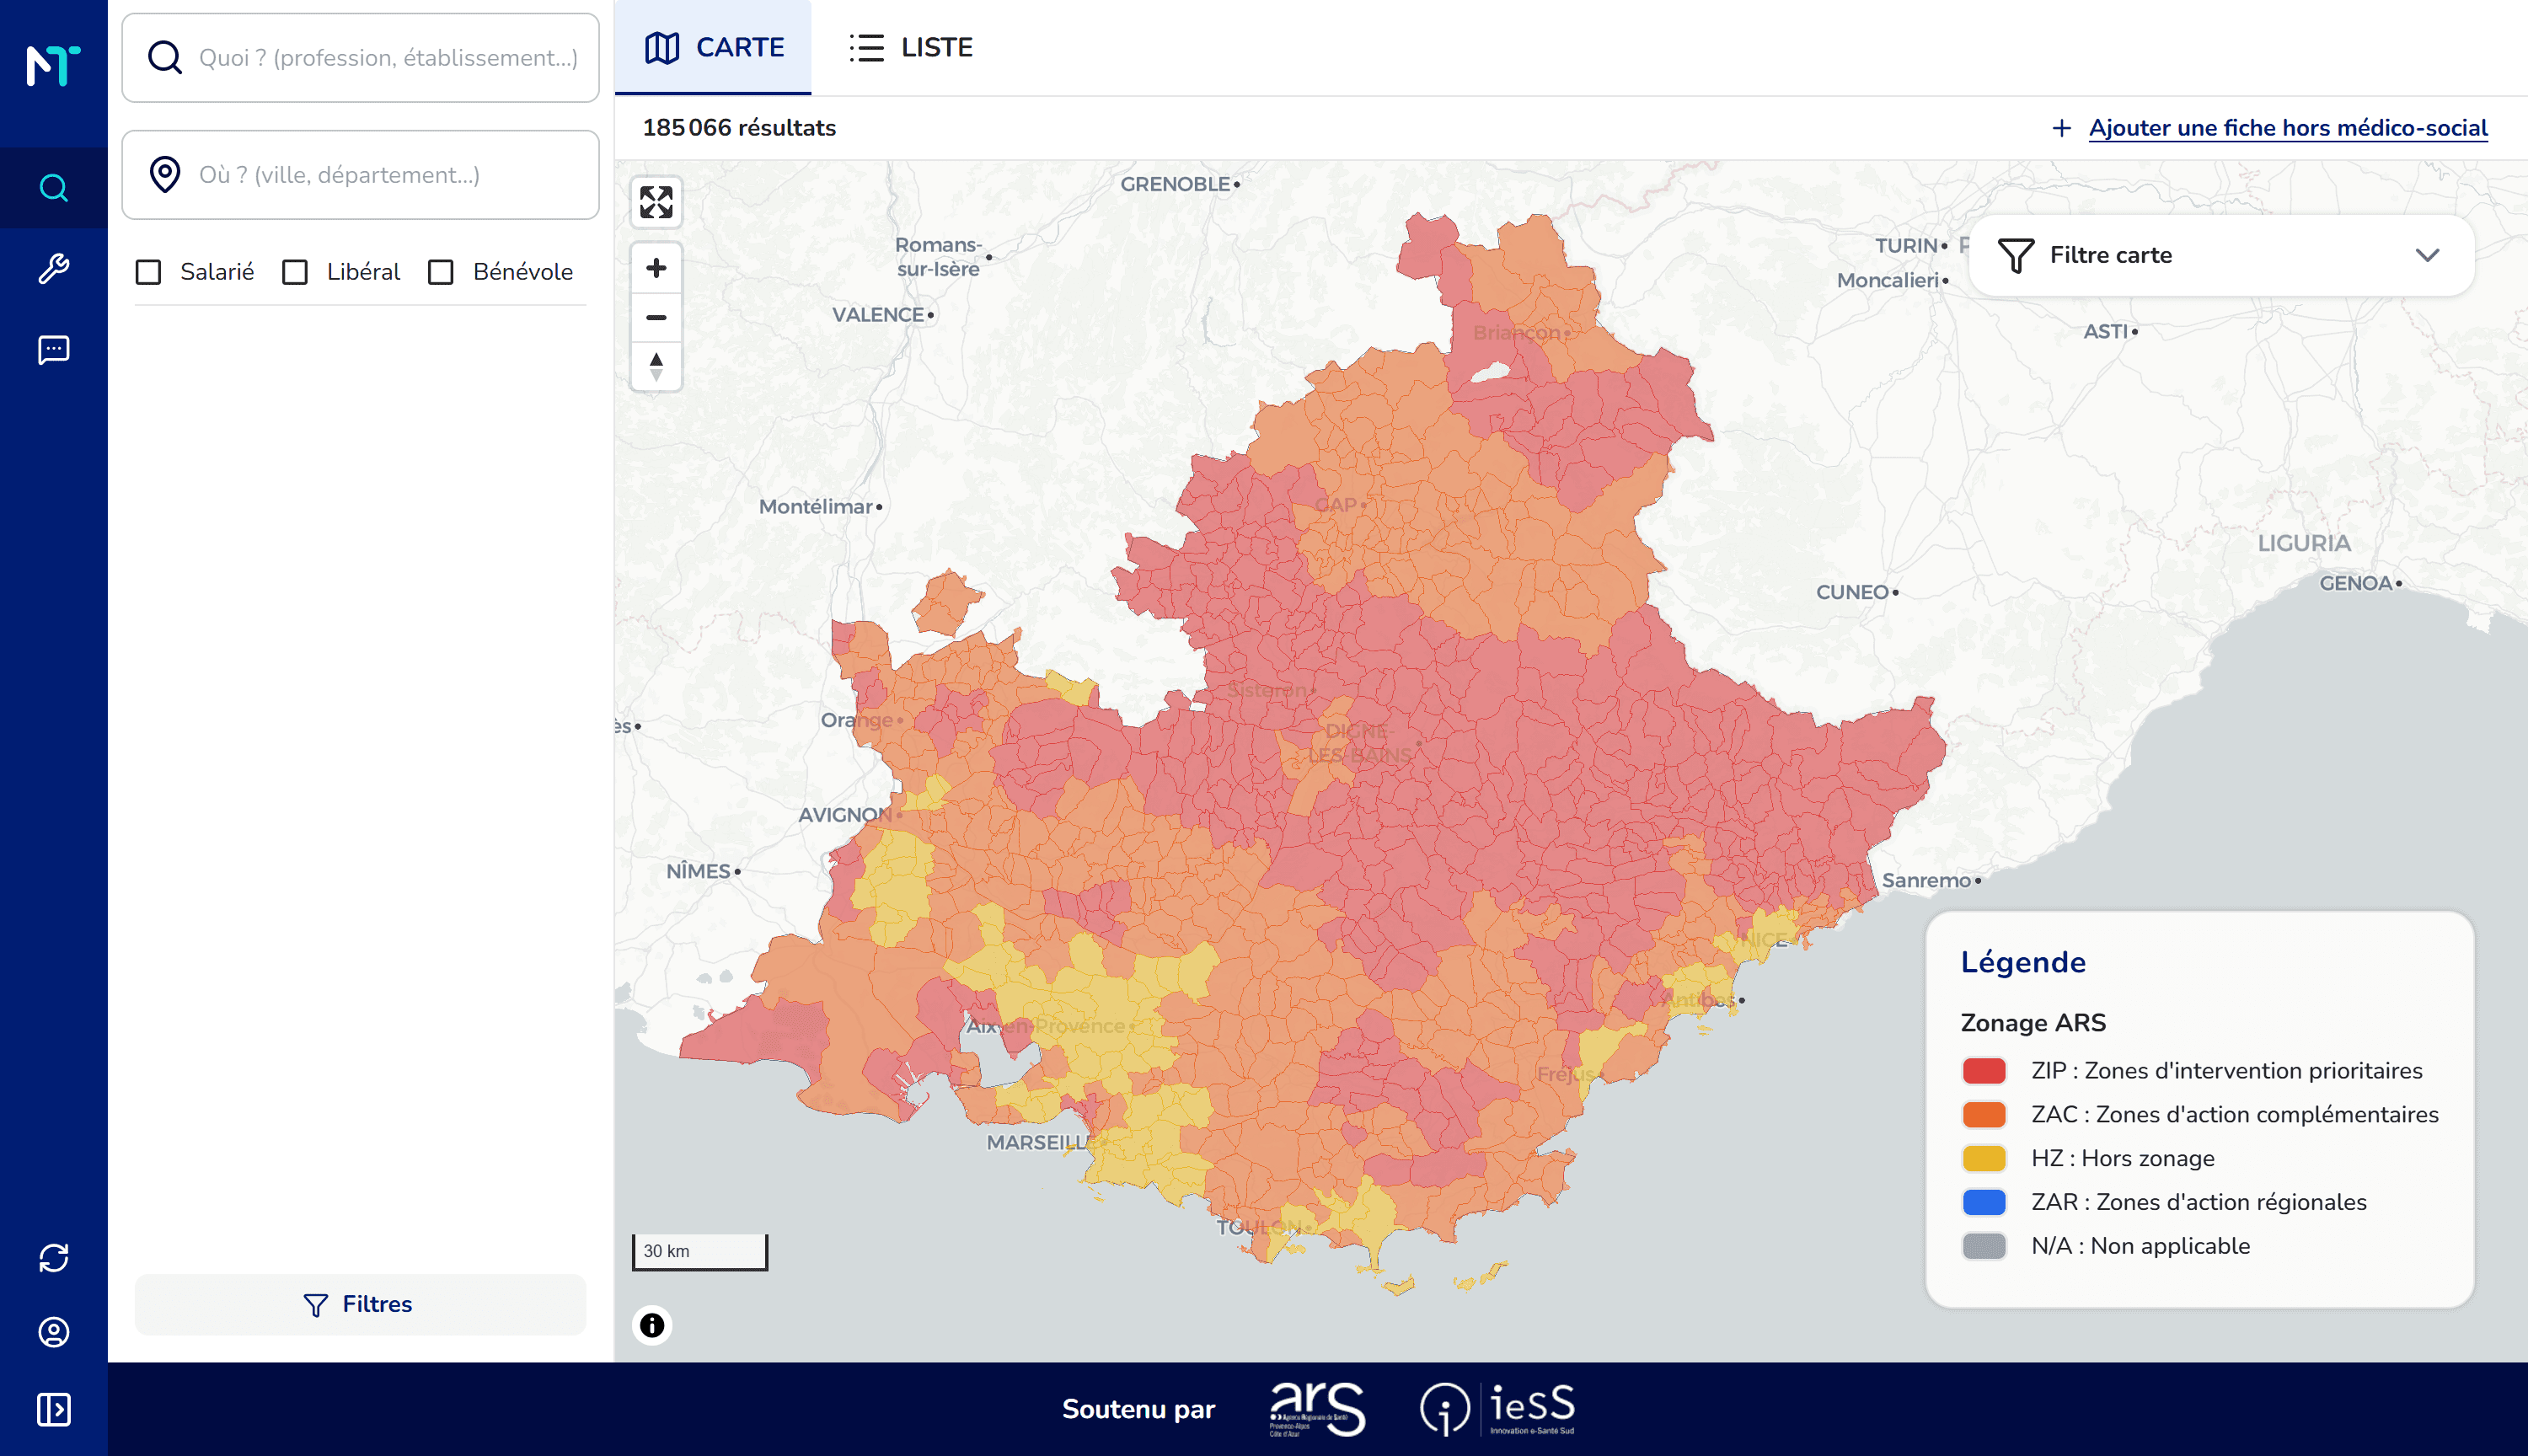
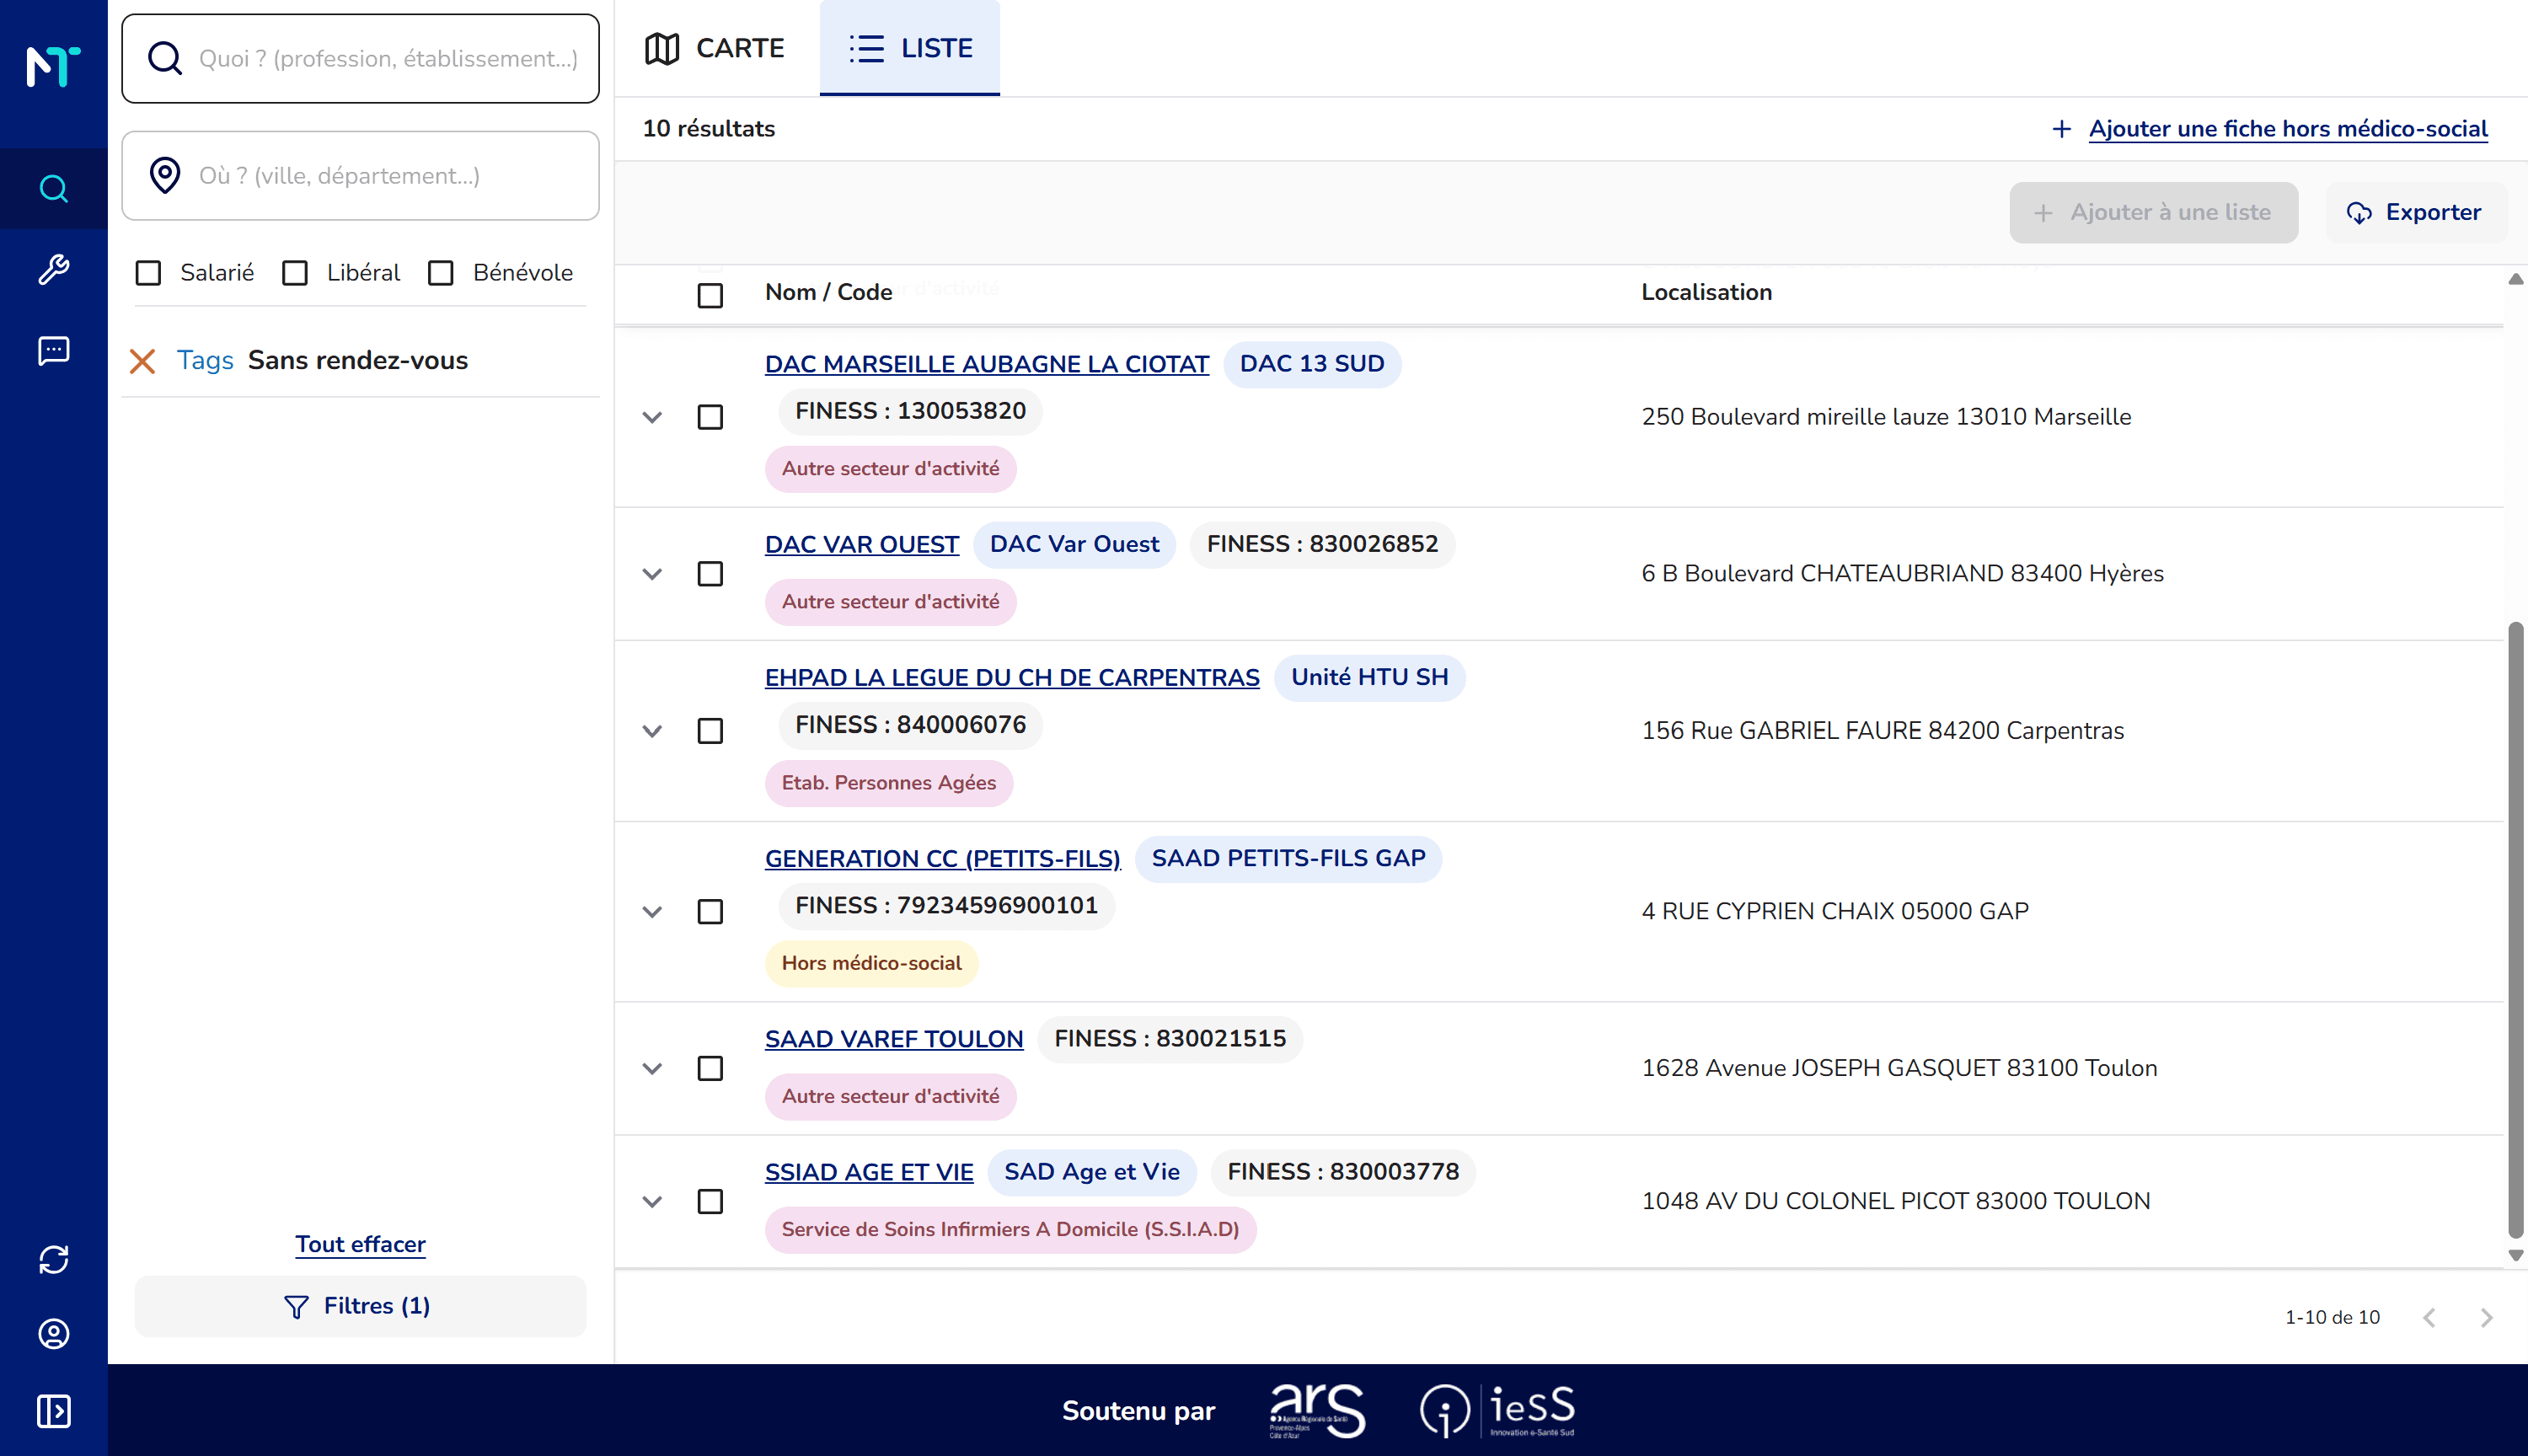
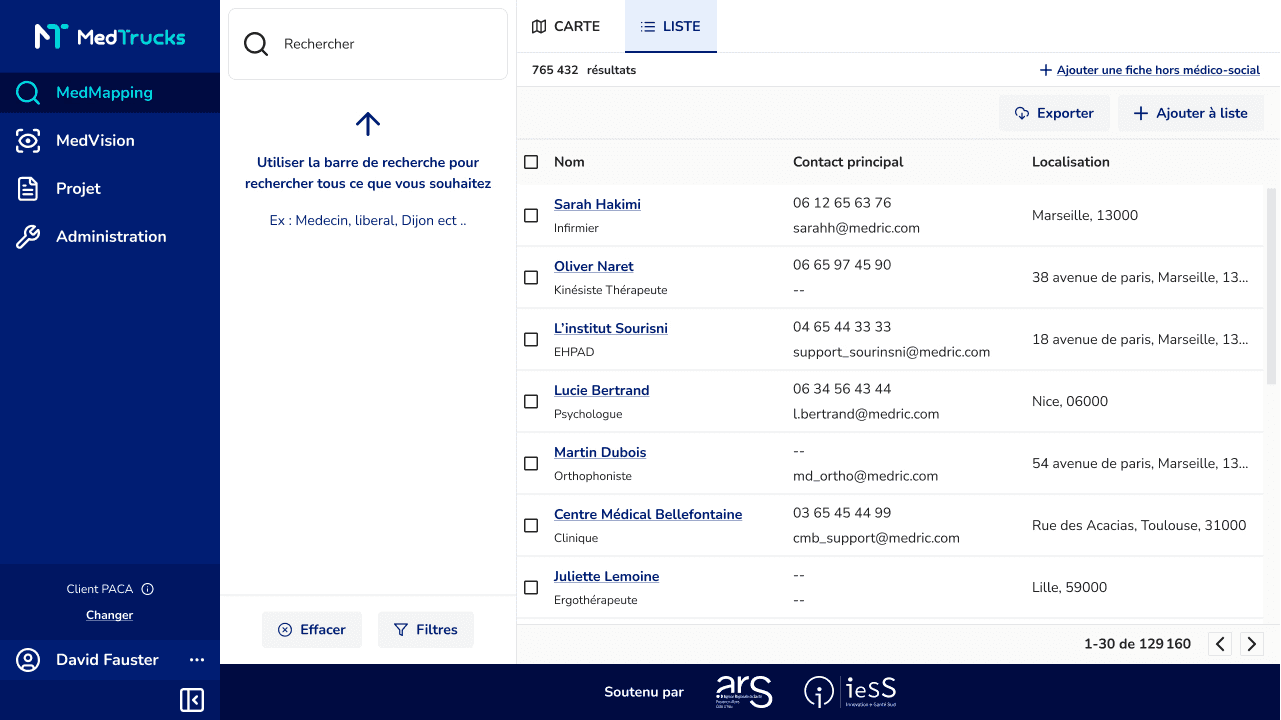
Screenshot of MedMapping showing ARS zoning for the PACA region

Increase the success rate of your programs

MedMapping

MedVision

MedMapping

MedVision

Identify key players in your region

Select target areas on an interactive map

Centralize your information in a single directory

Filter by profession, facility type, and region

Create custom lists for your regional healthcare programs

Anticipate your needs and make decisions with reliable data

Forecast retirements through 2035 by sector

Measure actual healthcare accessibility with APL maps

Generate your local healthcare assessments in 1 hour instead of 2 weeks

Easily export your reports for presentations

MedMapping

MedVision

MedMapping

MedVision

Identify key players in your region

Select target areas on an interactive map

Centralize your information in a single directory

Filter by profession, facility type, and region

Create custom lists for your regional healthcare programs

Anticipate your needs and make decisions with reliable data

Forecast retirements through 2035 by sector

Measure actual healthcare accessibility with APL maps

Generate your local healthcare assessments in 1 hour instead of 2 weeks

Easily export your reports for presentations

How GRADeS Grand-Est streamlines the rollout of telemedicine

How GRADeS Grand-Est streamlines the rollout of telemedicine

The GRADeS Grand Est oversees the regional rollout of telemedicine sites. To maximize the impact of this equipment, they needed to pinpoint underserved areas where installation was most urgently needed.

Tangible results achieved:

  • 16% of the population in Grand Est fell below the healthcare access threshold; thanks to MedTrucks, that figure dropped to 6%

  • Mapping telemedicine provision by cross-referencing ROR, RPPS, and APL data

  • Strategic targeting of priority areas for efficient deployment

  • Time saved: identify sites in days instead of months of analysis

Frequently asked questions from GRADeS

Where does the data you use come from?

How long does it take to deploy the solution in our region?

How do you ensure the data is up to date?

Can MedVision integrate our own regional indicators?

We already use regional tools. Can MedTrucks integrate with them?

How does MedVision specifically help us reduce the failure rate of our e-health projects?

MedTrucks

PariSanté Campus, 75015 Paris

contact@medtrucks.com

+33 (0) 6 13 91 52 68

MedTrucks on LinkedIn

Data hosted in France · GDPR compliant

© 2026 – MedTrucks – All rights reserved

PariSanté Campus
MedTrucks

PariSanté Campus, 75015 Paris

contact@medtrucks.com

+33 (0) 6 13 91 52 68

MedTrucks on LinkedIn

Data hosted in France · GDPR compliant

© 2026 – MedTrucks – All rights reserved

PariSanté Campus